

Professor William Goetzmann has a longstanding interest in long-term financial returns. “Financial history helps you estimate and plan,” he says. “Five years doesn’t help you with the trend. If you’ve got 150 years or more, that’s a good foundation for understanding where you may end up.”
Last year, Goetzmann began preparing a volume of articles for the 50th anniversary of his colleague Roger Ibbotson’s book Stocks, Bonds, Bills, and Inflation (SBBI), a landmark work that helped scholars and practitioners understand the long-term returns of various asset classes. Motivated by concerns about the growing concentration of market value in a handful of tech stocks, Goetzmann decided to devote his own scholarly contribution to Ibbotson’s tribute to examining whether a bubble in a single industry tends to lead to a wider market crash.
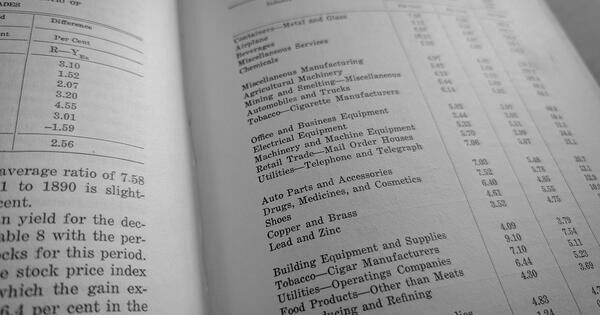
Answering the question would require a long series of industry-level historical stock price data. Goetzmann knew that in 2019, Robin Greenwood, Andrei Shleifer, and Yang You of Harvard had conducted a similar analysis using the Center for Research in Security Prices U.S. Stock Databases, which date back to 1926. “That’s 100 years’ worth of data right there,” he says. But then he remembered another source of industry data going back even further into financial history—one with Yale roots.
In the 1930s, Alfred Cowles III, a businessman and a Yale graduate, became disillusioned by the lack of measurement and scientific discipline in finance. Cowles partnered with the influential Yale economist Irving Fisher to painstakingly assemble the first complete picture of the disparate stock market, with data going back to 1871. Their project, which required 53 scholars and 1.5 million worksheet entries, was published in 1938.
Today, the Cowles Foundation for Research in Economics carries on the legacy of this revolution in empirical studies of economics. In 1955, its permanent home was established at Yale’s economics department. By that point, the original book of stock-price data, titled Common Stock Indexes, 1871-1937, had largely been forgotten.
A few decades later, though, Yale economist Robert Shiller became interested in Common Stock Indexes. The book provided key historical data for his paper “Do Stock Prices Move Too Much to Be Justified by Subsequent Changes in Dividends?,” which helped establish the field of behavioral finance and was cited when Shiller won the Nobel Prize. And eventually, he gave a copy to Goetzmann.
Over the years, Goetzmann hand-typed and refined much of the data from Common Stock Indexes. At some point, he lost his copy. But when he conceived the idea to use the Cowles industry data for his Ibbotson tribute, he still had a photocopy. With research assistants James Tyler and Otto Manninen, he set out to unearth trends in stock market behavior by combining Cowles data with more recent market data.
Their new working paper looks at the frequency of stock market booms, crashes, and bubbles from 1792 to 2024, extending Greenwood, Shleifer, and You’s work both forward and backward in time.
Counterintuitively, the team found that industry booms are more likely to be followed by additional gains than crashes. But that doesn’t mean that booming industries are stable. After a run-up in stock prices, volatility tends to increase, making both large gains and large losses more likely.
The authors find that bubbles in a particular industry—defined as a doubling in stock prices followed by a crash that reverses all of the gains—are extremely rare. True bubbles in the total market are also few and far between; using a similar definition, the researchers found just 10 episodes in more than two centuries of market history.
Their data also suggests that the overall market is more likely to recover from a crash than it is to continue falling. At a five-year horizon, full recoveries outnumber further declines at every crash threshold they examined.
Some may wonder, Goetzmann says, why market data from the 19th century should matter now. “What does that mean to me if I’m investing today?”
He argues that longer time series provide greater confidence in the findings. “The value of our analysis is that we have a complete, clean, independent, out-of-sample dataset.” For anyone wondering if the Harvard team’s “results were just because of survivorship bias or something else unusual, or ex-post defining the industries in a certain way, we did a test that proves their basic findings were all correct.”
Goetzmann still hopes that the copy of Common Stock Indexes that he received from Shiller will turn up in his vast collections of financial history books. “Sometimes I walk around my office and say, ‘Where could it be?’”
“The Yale School of Management is the graduate business school of Yale University, a private research university in New Haven, Connecticut.”
Please visit the firm link to site