

31 March 2026
Inflation expectations are crucial for monetary policy as they shape economic decisions and feed through to inflation. While expectation surveys provide insights, they come with blind spots. We use a model to transform infrequent survey data into a dense grid of expectations.
Measuring inflation expectations is crucial for monetary policy. What we expect tomorrow’s prices to be affects how we spend today and plan for the future. Financial investors, for example, will demand higher interest rates on assets when they expect inflation to increase. They want to be compensated for the expected additional loss of purchasing power. This influences financing conditions, spending and investment, which in turn affect inflation. In the same way, firms’ inflation expectations matter for their price-setting, a channel that economists capture within modern versions of the Phillips curve. And households likewise factor in their inflation expectations when deciding on saving and spending or asking for a pay rise.
But measuring these inflation expectations is a challenge. For those of financial investors, there are two methods: either we conduct surveys asking them what they expect or we infer their inflation expectations from market prices. Though both methods can offer valuable information, both also have their shortcomings. Market prices of so-called inflation swaps, for example, do not express market participants’ expectations directly. That is because these prices contain risk premia, which compensate investors for bearing inflation uncertainty.[1] And as these premia are not directly observable, we need to estimate them, which always leaves some uncertainty about the magnitude of actual inflation expectations. By contrast, surveys among professional forecasters provide a more direct measure of survey participants’ inflation outlook. But they are often available only quarterly or, if more frequent, for only a few forecast horizons.
This is where our model comes in. In this blog post we present a statistical method to mitigate this disadvantage of surveys. We apply a model to describe forecasters’ projections of headline inflation from the ECB Survey of Professional Forecasters (SPF) and from the Consensus Economics survey.[2] More concretely, the method allows us to enrich the information from surveys of professional forecasters, whose views tend to be closely aligned with those of financial investors. We do so by estimating survey participants’ expectations at a monthly frequency for essentially any future horizon.
How to tackle blind spots in surveys
Our model identifies a small set of statistical factors that explain most of the dynamics of reported average forecasts for various horizons over time. These factors are not directly interpretable, but they can be thought of as capturing the information that matters for forecast dynamics. We then estimate these factors each month using their historical co-movements with survey forecasts. This allows us to infer expectations even for points in time that were not covered by the forecasts. In other words, for every month, we fill in missing horizons and construct a smooth, monthly curve. We can display inflation expectations from one month up to ten years ahead, going back to 1999.[3]
To demonstrate the benefits of our method, we apply it to an especially interesting period: the recent inflation surge between 2021 and 2022 and respond to three key questions. Did forecasters anticipate the inflation surge? How did they adjust their projections as prices accelerated? And where do they expect inflation to go next?
Our method yields three main insights:
- Until the peak was reached, forecasters underestimated both the scale and persistence (see dotted and solid lines in Chart 1) of the 2021–22 inflation surge.
- They revised up their outlook for the coming 12 months and beyond above the 2% inflation target only well after Russia’s invasion of Ukraine (red line to yellow line in Chart 1).
- Despite these upward revisions, medium-term expectations remained firmly anchored around 2% at all times (solid lines in Chart 1). Forecasters projected a return to target within two years, even when asked at the peak of inflation (green line in Chart 1).
The robustness of medium-term anchoring was crucial. When the ECB began raising its key policy rates in July 2022, these stable expectations helped to contain longer-run inflation pressures. The stability of inflation expectations made the disinflationary adjustment quicker and less costly.[4]
Chart 1
Realised and expected inflation rates
(percentages per annum)
Sources: Consensus Economics (CE), ECB Survey of Professional Forecasters (SPF), Eurostat and ECB calculations. Notes: The chart presents actual inflation, observed year-on-year inflation forecasts from Consensus Economics for the next 12 (before April 2022) to 15 months (dotted lines), along with model-based forward curves of year-on-year inflation expectations (solid lines) up to three years ahead. The curves are calculated by taking the actual level of the headline HICP index at the cut-off date and projecting it for each future month using the forward inflation rates derived from a Dynamic Nelson-Siegel model (DNS). The model incorporates monthly, quarterly and calendar year forecasts from the Consensus Economics survey and the ECB Survey of Professional Forecasters (SPF) for horizons 12-month ahead and beyond, since January 1999. The latest observation is for November 2025.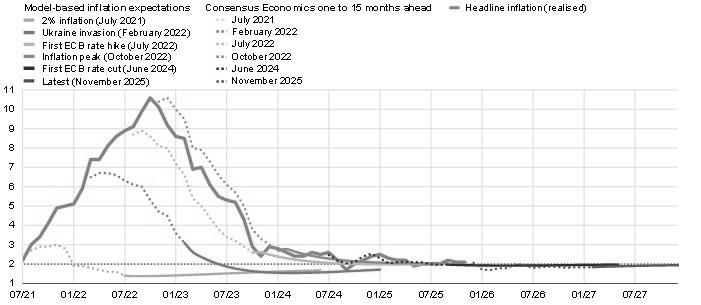
Key phases in the formation of expectations
Let’s take a closer look. As mentioned above, our enhanced survey information allows us to better analyse and trace forecasters’ views. For example, it allows us to extend the horizon of year-on-year inflation forecasts (solid lines in Chart 1), whereas the surveys we consider here only provide forecasts for up to 15 months ahead (dotted lines in Chart 1).[5] It also allows us to construct forecasts for inflation over periods spanning 12 months and we can let those periods start in each future month up to five years ahead (all lines in Chart 2). This is useful also because reported expectations for year-on-year inflation rates below the 12-month forecasting horizon already reflect realised changes in the price level and typically increase if inflation rates are very high.
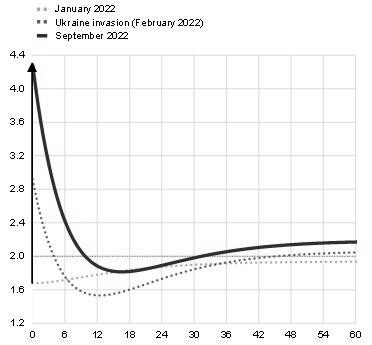
Based on this information, we can identify February 2022 as the month when fast-climbing prices fed through to forecasters’ medium-term expectations. Just a few weeks earlier the situation was different. In January 2022, even as inflation had climbed rapidly from 2% in July 2021 to 5% within six months, forecasters’ expectations for the coming 12 months remained moderate (Chart 2, panel a). At that time, projections for inflation over that period stood at 1.6%, with a gradual return to the ECB’s 2% target within three years. This divergence reflected the widespread belief that rising prices were transitory prior to Russia’s invasion of Ukraine.
The invasion in February 2022 fundamentally changed this background. Expectations for inflation over the next 12 months jumped from 1.6% to 2.8% in a single month in anticipation of a surge in energy costs. Despite this upward adjustment, forecasters still expected inflation to return to around 2% shortly thereafter.
By September 2022, just before inflation peaked, inflation expectations for the following 12 months climbed to 4.3%, over one percentage point higher than in February. The projected return to 2% was delayed by about a year. Notwithstanding these changes, longer-term forecasts (from two years onwards) remained near 2%.[6]
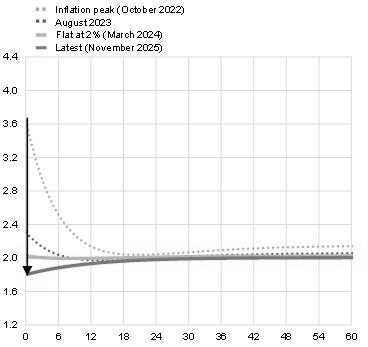
After inflation peaked in October 2022, forecasts for the coming 12 months and beyond stabilised (Chart 2, panel b). Professional forecasters projected a 3.6% inflation rate over the next 12 months, with a return to around 2% not expected until mid-2024 to mid-2025. Subsequent revisions were minor, reflecting growing confidence in a disinflationary path supported by restrictive monetary policy. By March 2024, short, medium and long-term expectations aligned at essentially the ECB’s 2% target.
Most recently, inflation expectations for the coming 12 months again fell below 2%, likely reflecting low expected energy inflation. At the same time, after bottoming out at around 1.8% in late 2026, headline inflation is expected to return to levels around 2% through 2027. This shows that medium-term forecasts remain firmly anchored at the ECB’s 2% target.
Chart 2
Key phases in the formation of expected inflation
(percentages per annum)
|
a) The inflation surge |
b) From peak to target |
|---|---|
 |
 |
Sources: Consensus Economics (CE), ECB Survey of Professional Forecasters (SPF) and ECB calculations.
Notes: The curves correspond to one-year forward inflation expectations, i.e. expectations of one-year expectations one, two, three or more months ahead derived from the survey-based Dynamic Nelson-Siegel model, estimated on Consensus Economics and ECB SPF data since January 1999. Horizon “0” corresponds to the one-year spot inflation expectations, i.e. expectations over the coming 12 months at that point in time. The model estimates rely only on survey forecasts from 12 months ahead and beyond. The latest observation is for November 2025.
Two lenses for one diagnosis
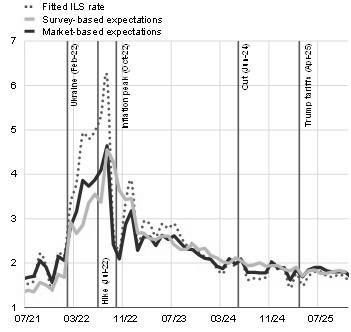
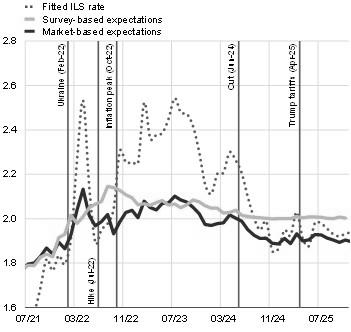
As we mentioned earlier, the expectations of market participants provide another lens on euro area inflation dynamics. Market participants’ inflation expectations can be assessed by looking at assets linked specifically to inflation which reflect the bets made by investors on how the general price level in the economy will evolve. However, prices of inflation-linked assets are a mix of true inflation expectations and an inflation risk premium, and the latter can fluctuate sharply (Chart 3).
To isolate pure expectations, we apply an empirical model, taking a similar approach to that adopted for the surveys above. This means we again identify a set of factors that help explain the variation in inflation-linked swap rates as well as disentangle how much these rates reflect pure inflation expectations and how much they reflect premia. Despite the common uncertainty inherent in such methods, this allows us to reach an estimate of the inflation risk premium from inflation-linked rates.[7] We can then directly compare the resulting “clean” estimates of investors’ inflation expectations with our survey-based measure. This comparison is especially helpful in light of the imperfections that come with both methods as it serves as a cross-check that can increase our confidence in both sets of estimated expectations.
Chart 3 confirms that, over short and medium-term horizons, survey inflation expectations align closely with the inflation expectations that we derive from market prices, once we adjust them for inflation risk premia. This was true during both the inflation surge and the subsequent disinflation. The premia-cleaned market measures are thus closer to their survey counterparts than to the original pure market measures. A larger divergence between market-based expectations and surveys appears for the medium-term horizon at the inflation peak in October 2022. The survey-based forecasts then anticipated a more gradual decline, while expectations inferred from market prices pointed to a quicker return of inflation to 2% over 2023 (before slightly drifting up again). Overall, however, both lenses tell the same story. The scale of the shock initially surprised market participants, who rapidly revised their near-term outlooks, but – crucially – remained confident throughout that inflation would settle back around the ECB’s 2% target.
Chart 3
Short and medium-term expectations of HICP inflation
(percentages per annum)
|
a) One-year |
b) One-year in four years |
|---|---|
 |
 |
Sources: Consensus Economics, ECB Survey of Professional Forecasters, Bloomberg and ECB calculations.
Notes: The dotted line refers to the fitted inflation-linked swap (ILS) rates adjusted for the indexation lag. Market-based expectations represent ILS rates cleaned for inflation risk premia using an average of two affine term-structure models according to Joslin, Singleton, and Zhu (2011); see Burban, V. et al. (2021), “Decomposing market-based measures of inflation compensation into inflation expectations and risk premia“, Economic Bulletin, Issue 8, ECB. Survey-based expectations are derived from the Dynamic Nelson-Siegel model, estimated on Consensus Economics and ECB SPF data since January 1999. The latest observation is for November 2025.
Conclusion
Our approach offers a useful complementary step towards improving our monitoring of inflation expectations over time and across horizons. By transforming sparse survey data into a richer and more timely picture of expected inflation, this approach gives policymakers an additional tool to assess how shocks feed into inflation expectations and how firmly those expectations remain anchored. This type of information is particularly valuable at a time when inflation and inflation expectations have moved back into the spotlight, amid renewed energy price pressures linked to the ongoing conflict in the Middle East.
The views expressed in each blog entry are those of the author(s) and do not necessarily represent the views of the European Central Bank and the Eurosystem.
Check out The ECB Blog and subscribe for future posts.
“The European Central Bank is the prime component of the Eurosystem and the European System of Central Banks as well as one of seven institutions of the European Union. It is one of the world’s most important central banks.”
Please visit the firm link to site