

9 April 2026
Many Bulgarians feared large price increases when the euro replaced the lev. However, preliminary evidence shows that the changeover in Bulgaria has so far had a limited impact on consumer prices and on perceptions of inflation.
As in other countries that have introduced the euro, public support for adoption of the new currency in Bulgaria was affected in the run-up to the changeover by concerns about possible price increases.
Such concerns typically relate to upward rounding practices, changeover costs and opportunistic price-setting, particularly in sectors where transparency and competition are limited. To reduce these risks, the Bulgarian authorities have implemented measures including price monitoring and inspections to address abusive practices. They have also required vendors to display prices both in euro and in lev for a full year (from August 2025 to August 2026).
This blog post presents preliminary evidence suggesting that, as in earlier changeovers, the transition from the lev to the euro has so far had a limited and largely one-off impact on consumer prices, concentrated in the services sector. Meanwhile, perceived inflation has remained in check. And as survey evidence indicates, concerns about increasing prices have begun to ease while public support for the euro is on the rise.
How did the changeover affect prices in Bulgaria?
The Harmonised Index of Consumer Prices (HICP) for Bulgaria in January and February 2026 indicates that inflation measured as the change in prices compared with 12 months before continued its moderating trend.[2] It declined from 3.5% in December 2025 to 2.3% in January and 2.1% in February. While year-on-year inflation is the standard measure monitored in monetary policy, month-on-month developments provide a timelier indication of recent price dynamics. However, they are more sensitive to seasonal patterns. Such patterns include post-holiday price adjustments in January, seasonal movements in food prices (notably fresh fruit and vegetables), or summer increases in travel and accommodation prices. Prices increased by 0.6% in January 2026 compared with December 2025, i.e. before the adoption of the euro. This figure is indeed unusually high for a typical January. So, while inflation continued on a downward trend, we see an upward tick after the changeover on a month-on-month basis.
What is behind this? A closer look reveals that price increases were driven mainly by food and services. Meanwhile, energy and non-energy industrial goods prices fell compared with December.
Given the pronounced seasonality of some HICP components, we compared month-on-month developments in January 2026 with January developments over the period 2011-21. The years 2022-25 are excluded from the benchmarking period because of high inflation and frequent policy interventions such as VAT changes, which may blur underlying seasonal patterns in price developments.
This comparison shows that the prices of services recorded an unusually strong increase in January 2026 compared with past January readings (Chart 1, left panel). At the same time, developments in the other main components of the price index remained broadly in line with historical patterns. Looking deeper into the category of services, prices rose more strongly in several areas. Among these are a range of administrative, legal and other personal services, restaurants and accommodation, health services, rents, and domestic and household services. Transport-related services, such as maintenance and repair, as well as insurance services, recreational services and personal care services including hairdressing also showed higher than usual price increases.
Yet it is only January that looked different. In February, month-on-month HICP growth stood at 0.2%, with all main components, including services, broadly consistent with past seasonal patterns (Chart 1, right panel). Only a few items in the services sector still recorded month-on-month increases above their historical averages. These were restaurants and accommodation, and information and communication. This suggests that the January increases were predominantly short-lived. They have not so far translated into broader or persistent price pressures.
Chart 1
Headline HICP inflation and its main components in Bulgaria
(month-on-month percentage changes)
Sources: Eurostat and authors’ calculations. Notes: The blue dots indicate the month-on-month percentage change in headline HICP and its components in January and February 2026. The red dots indicate the average month-on-month percentage change in January and February over the period 2011-21. The yellow bars indicate the minimum-maximum range of month-on-month percentage changes in January and February over the period 2011-21. 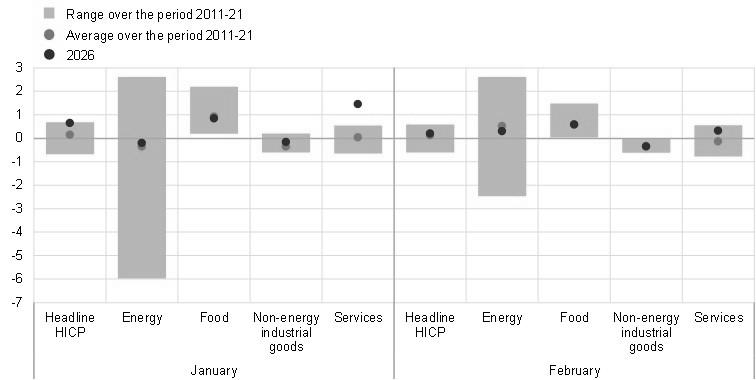
What role did the introduction of the euro play in all this? To quantify the potential impact of the changeover, we conducted a counterfactual exercise. We assumed that the January 2026 month-on-month price growth rates for selected services components – those showing the largest deviations from historical trends – had followed their average January increases for the period 2011-21. According to these calculations, inflation in Bulgaria would have been between 0.3 and 0.4 percentage points lower than the actual recorded figure.[3] So the new currency could indeed have caused a slight inflationary uptick. This preliminary estimate is broadly consistent with findings from earlier studies of euro changeovers, which generally point to mild, one-off effects concentrated in parts of the services sector.[4] These sectors often have more differentiated products and a stronger local dimension, which can limit the intensity of competition and make it easier for firms to adjust prices.
We complement these findings with an analysis of micro data from retail chains in Bulgaria. These data show that price changes during the euro changeover were minimal and typically amounted to only a few euro cents (Chart 2, panel a). This suggests that retailers adhered to the fixed conversion rate and legal rounding rules. We see no evidence of systematic upward price adjustments.
Consistent with this finding, the proportion of “attractive” prices – i.e. prices with endings that sellers believe to be appealing to consumers, such as €0.99 – declined markedly following the euro changeover. This reflects the mechanical conversion of lev prices into euro (Chart 2, panel b). Since then, this share has gradually increased, suggesting that retailers are progressively realigning prices towards commonly used price endings. Again, evidence from earlier euro changeovers indicates that such adjustments typically take place over time. They occur often in the context of regular price revisions and cost developments, rather than as a direct consequence of the changeover itself. And the same seems to be the case for Bulgaria. This also suggests that retailers did not systematically raise prices when the euro was introduced.
Chart 2
Pricing strategy at big retail chains before and after the euro changeover
(panel a: y-axis: density, x-axis: euro cents; panel b: percentages)
|
a) Distribution of price changes |
b) Prices by type of price ending |
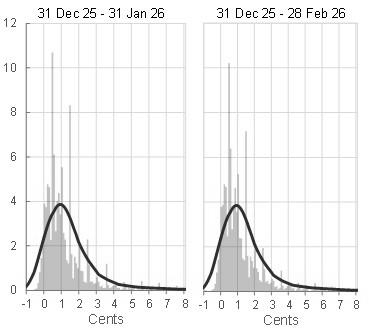 |
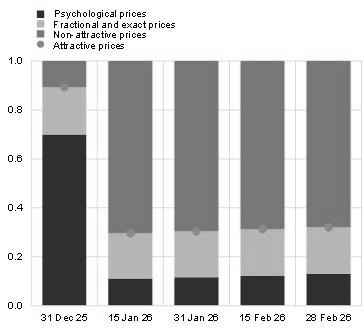 |
Sources: Price monitoring portal maintained by Bulgaria’s Consumer Protection Commission and authors’ calculations.
Notes: The analysis covers price observations (in lev before the changeover and in euro thereafter) for around 1.4 million products, including food, beverages, tobacco products, cleaning and maintenance goods, personal hygiene items and medicinal products, collected from large retail chains in Bulgaria. Panel a): the histograms show the distribution of price changes around the official conversion rate, expressed in euro cents. The solid lines represent kernel density estimates. Price changes are computed as the difference between the euro price and the lev price converted to euro at the irrevocably fixed conversion rate. Panel b): attractive prices are classified into three categories: (i) psychological prices, defined as prices with endings commonly used to make prices appear lower (e.g. prices ending in 9, 19, 29, 39, 49, 59, 69, 79, 89, 90, 95 or 99); (ii) fractional prices, which facilitate the return of change (e.g. prices ending in 5, 10, 15, 20, 25, 30, 35, 40, 45, 50, 55, 60, 65, 70, 75, 80 or 85); and (iii) exact prices, corresponding to whole-number prices. Non-attractive prices comprise those with all remaining price endings.
However, an econometric analysis suggests that some price adjustments may have been made ahead of the euro changeover. A time series model for services inflation indicates that on average monthly inflation between May and December 2025 may have been around 0.4 percentage points higher than implied by underlying cost and demand fundamentals.[5] So, once it was clear that Bulgaria would be adopting the euro, some retailers did indeed already start to adjust their prices. On the basis of this estimate, a counterfactual path was constructed for services inflation to assess the potential effect on headline inflation. Overall, the results suggest an impact of roughly 0.1 percentage point on headline inflation in 2025.
What was the impact of the changeover on price perceptions?
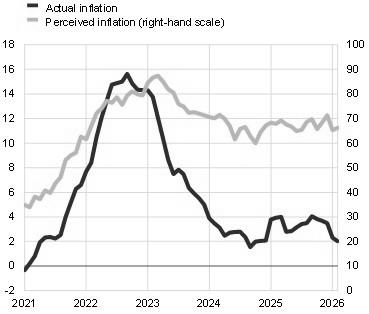
Let us now take a look at how the currency changeover affected the way Bulgarians perceived price movements. During previous euro changeovers, consumers often perceived inflation to have increased, with perceived inflation diverging at times from actual inflation. Such a perception gap may reflect the greater sensitivity of consumers to prices for frequently purchased goods and services. Unfamiliarity with the new currency and considerable media attention to price developments may also play a role. Although these effects are typically temporary and do not lead to persistent shifts in inflation expectations, it is important to monitor price perceptions in order to support effective communication and preserve public confidence during the changeover period.
In January 2026 perceived inflation in Bulgaria, as suggested by survey-based indicators, declined significantly – the largest drop recorded since the COVID-19 pandemic – albeit still with a net balance of respondents reporting price increases (Chart 3, panel a). Moreover, measured inflation moderated and consumer expectations of price increases over the next 12 months eased (Chart 3, panel b). This suggests that both perceived inflation and inflation expectations have been unaffected by the changeover.[6]
Chart 3
Inflation perceptions and expectations
(left-hand scale: annual percentage changes; right-hand scale: balances)
|
a) Perceived inflation |
b) Expected inflation |
 |
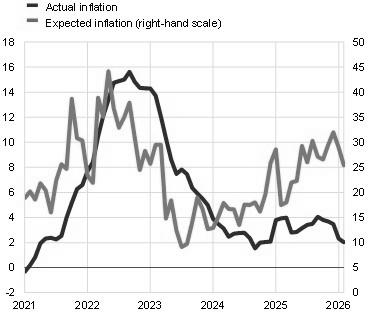 |
Sources: Eurostat and European Commission.
Notes: Inflation perceptions and expectations obtained from the European Commission’s consumer survey. The indicators are based on the share of respondents reporting price increases (for perceived inflation) and expecting prices to increase (for expected inflation). Perceived inflation is based on replies to the question: “How do you think that consumer prices have developed over the last 12 months? They have: (a) risen a lot; (b) risen moderately; (c) risen slightly; (d) stayed about the same; (e) fallen”. Respondents may also respond “don’t know”. Expected inflation is based on replies to the question: “By comparison with the past 12 months, how do you expect that consumer prices will develop in the next 12 months? They will: (a) increase more rapidly; (b) increase at the same rate; (c) increase at a slower rate; (d) stay about the same; (e) fall.” Respondents may also respond “don’t know”. The latest observations are for February 2026.
From concerns to confidence
While price perceptions did not change after the changeover, public support for the euro in Bulgaria did. Surveys show that support not only exceeded 50% in January 2026 but rose further to 54% in February, marking majority support for the first time in recent years (Chart 4, panel a). The strengthening in public support since adoption of the euro is consistent with patterns seen in previous euro changeovers.[7] It likely reflects the limited price effects of the changeover and the resultant fading of earlier concerns.
Chart 4
Attitudes towards the euro
(as a percentage of the total)
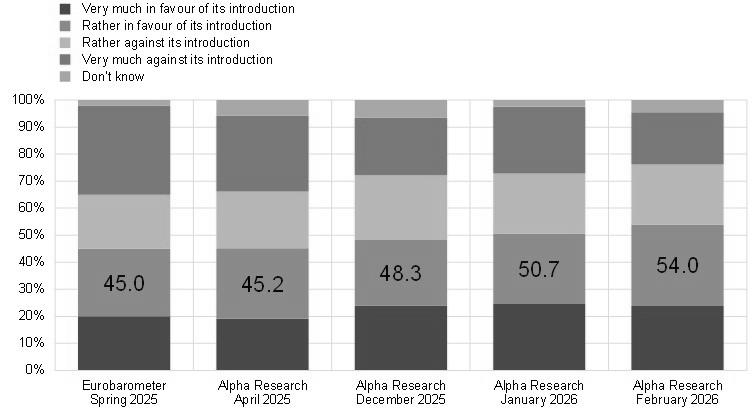 |
Sources: European Commission (Eurobarometer) and Alpha Research.
Notes: The first bar shows responses to the question “Generally speaking, are you personally more in favour or against the idea of introducing the euro in [Bulgaria]?” from the Eurobarometer survey entitled “Introduction of the euro in the Member States that have not yet adopted the common currency”. The remaining bars show responses to the question “Do you approve of Bulgaria’s accession to the euro area?” from surveys conducted by Alpha Research. The figures displayed show the aggregate percentage of respondents in favour of euro adoption.
Main takeaways
Overall, on the basis of the data available so far, three key findings stand out.
First, despite concerns among the public, Bulgaria’s changeover to the euro on 1 January 2026 has had a limited and largely a one-off impact on consumer prices, with some evidence of price adjustments ahead of the changeover.
Second, perceived inflation and expectations of price increases have been unaffected by the changeover.
Third, public support for the euro has risen above 50% as earlier concerns about price increases have started to ease.
All of these developments are consistent with patterns observed in previous euro changeovers. They provide useful insights for other EU Member States preparing to adopt the euro in the future. Looking ahead, it will be important to continue monitoring price developments to ensure that any further adjustments remain contained.
The views expressed in each blog entry are those of the author(s) and do not necessarily represent the views of the European Central Bank and the Eurosystem.
Check out The ECB Blog and subscribe for future posts.
For topics relating to banking supervision, why not have a look at The Supervision Blog?
“The European Central Bank is the prime component of the Eurosystem and the European System of Central Banks as well as one of seven institutions of the European Union. It is one of the world’s most important central banks.”
Please visit the firm link to site