

6 May 2026
Digitalisation is reshaping how banks pass on monetary policy. Compared with their branch‑based peers, digital banks are faster at adjusting deposit pricing for policy changes, but slower at updating their loan pricing.
As more people manage their finances on a laptop or smartphone rather than at the counter in a local branch, the way monetary policy moves through banks is evolving. This blog post briefly sketches the euro area universe of digital banks – those that operate almost entirely online – and examines their behaviour over the recent monetary policy cycle.
During the 2022-23 monetary policy tightening phase, digital banks adjusted the interest rates they pay on deposits faster and by more than traditional banks. By offering higher interest rates, they kept retail deposits flowing in. At the same time they did not raise lending rates more than their peers. This compressed their margins – the difference between what digital banks earned on lending and what they paid on deposits – relative to other banks. Consequently, digital banks expanded their lending less.
Early evidence from the 2024-25 easing phase points to a partial reversal. Digital banks started to reduce deposit rates for new customers more quickly than traditional banks. This has been supporting a recovery in their margins and lessening their earlier advantage in attracting deposits. The big picture is that bank digitalisation strengthens the bank funding leg of the lending channel of monetary transmission.
Comparing digital and traditional banks
The analysis below is based on a panel of over 170 digital banks operating in the euro area, observed in supervisory reporting from 2016 to 2025. These banks can be grouped into three business types: e-retail – deposit-funded, household-facing; e-service – payments/servicing and fee-heavy; and e-wholesale – market and corporate-focused.
On average, digital banks are smaller than their branch-based peers. Their balance sheets rely more heavily on overnight retail deposits, include larger cash buffers and contain more intangible assets (for example software platforms, IT systems, and brand-related assets). Digital banks also generate a bigger share of income from fees and commissions alongside interest income. Their footprint in the banking system remains modest. However it has grown steadily over the past decade, with many new entrants during the low interest rate period, and the first bank closures occurring during the tightening phase (Chart 1).
Chart 1
Expansion of digital banks in the euro area
(digital bank assets as a percentage of euro area banking system assets)
Notes: Banking system assets include assets of branches of foreign banks active in the euro area. Values shown are as at the end of the relevant period. Sources: Financial reporting (FINREP) framework data and own calculations.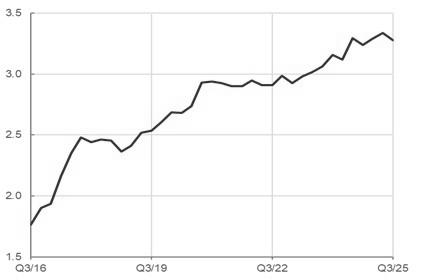
To assess how monetary policy transmission differs for digital banks, they are compared with similar branch-based institutions. The focus is on key variables such as deposit and lending rates, as well as funding and lending volumes. The analysis spans the recent tightening phase of monetary policy starting in July 2022 and the early easing phase from June 2024. The findings are consistent across different data sources – supervisory, monetary and publicly available data all confirm the overall patterns.
Five takeaways about digital banks’ behaviour
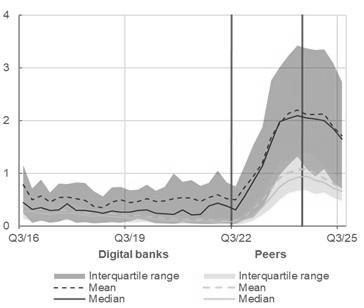
First, deposit pricing adjusts faster at digital banks. When policy rates increased, digital banks lifted household deposit rates both by more, and more quickly, than their peers (Chart 2). This pattern is strongest for stand-alone digital banks – those without the support of a broader banking group that often includes more traditional entities.
Why is that so? It reflects the nature of app-based banking, which lowers search and switching costs. Digital banks face greater pressure to reprice deposits quickly to retain customers. Group-affiliated digital banks tend to adjust more gradually, because group reputation and the branch networks of affiliated banks increase depositor trust, dampening immediate funding pressure.
Chart 2
Household deposit rates and retail funding spreads (digital vs benchmark)
|
(household deposit rates; per cent) |
(retail funding spreads; per cent) |
 |
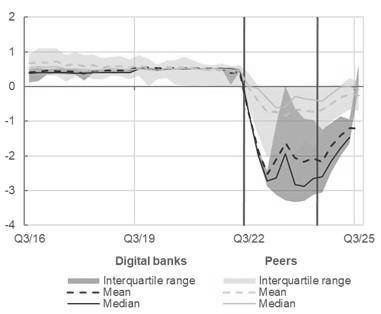 |
Notes: Household deposit rates are annualised. Retail funding spreads equal the difference between the retail funding rates and the corresponding risk-free rates. The vertical lines mark the beginning of monetary policy tightening and easing phases, respectively.
Sources: Financial reporting (FINREP) framework data, common reporting (COREP) framework data and own calculations.
Second, the loan rates of digital banks are less responsive. Despite higher funding costs, loan rates at digital banks rose by about the same amount as those of their peers.
This implies that transmission is stronger on the funding side than on the lending side for digital banks. Lending competition between digital banks and the desire to attract new customers appear to limit the extent to which they can pass on higher funding costs through loan rates.
Third, prices did the heavy lifting. Digital banks kept retail deposits flowing through the tightening phase – primarily by paying their depositors well (Chart 3). At the onset of the tightening phase, there was no clear acceleration of deposit inflows to digital banks relative to peers – but there was no relative slowdown either. Their structurally high deposit inflow continued.
This suggests that adjustments during tightening occurred mainly through prices, i.e. higher deposit rates, rather than changes in deposit volumes.
Fourth, digital banks ultimately slowed down their lending compared to peers. As funding costs stayed high and loan repricing lagged, lending growth at digital banks slowed more than at traditional banks. This is consistent with their margins being squeezed.
Chart 3
Deposit, funding and loan growth during different monetary cycle phases – before tightening, during tightening and during easing: digital banks vs peers
(per cent)
Notes: Quarter-on-quarter growth rates are shown. NFPS stands for the non-financial private sector: households and non-financial corporates. The horizontal lines within the bars show the sub-sample means, the dots show the corresponding medians and the bars represent the interquartile range. Sources: Financial reporting (FINREP) framework data, common reporting (COREP) framework data and own calculations.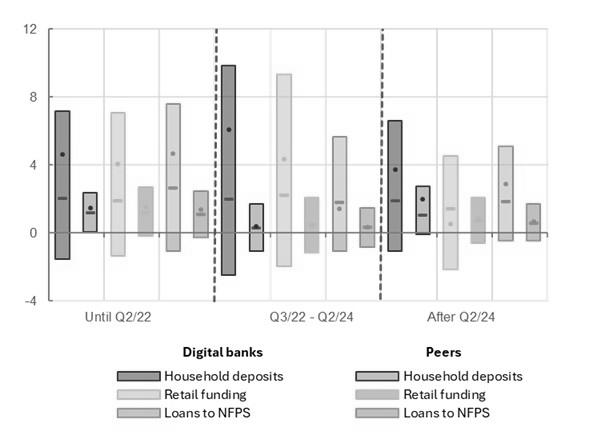
Fifth, transmission on the funding side also occurs earlier for digital banks in the easing phase. With the first monetary policy rate cuts in 2024-25, new deposit rates at digital banks fell faster than at traditional banks, particularly for longer maturities. This helped their margins to normalise. But the earlier deposit-attraction advantage narrowed, with household deposit inflows declining relative to peers. Digital banks’ lending rates declined more gradually, remaining “sticky” on the way down.
What does this mean for monetary policy transmission?
Monetary policy transmission increasingly operates through the bank funding channel. In more digital, search-intensive markets, deposit rates adjust more and earlier in response to policy changes, while lending rates remain sticky. During a monetary policy tightening, this reduces margin and slows balance sheet expansion for banks.
Transmission also differs between tightening and easing phases. As policy eases, digital banks are quicker to reduce the deposit rates offered to customers, but the earlier price premium takes time to unwind as existing balances reprice slowly. Lending volumes respond with a delay. So during the easing phase deposit interest rates adjust earlier than at traditional banks but this adjustment gap is narrower than during the tightening phase.
What does this mean for financial stability? Squeezed margin during tightening – that recovers only partially and with a delay during easing – can strain profitability at digital banks and erode their market value if sustained. In an increasingly digital banking system, more banks may be exposed to profitability squeezes and capital erosion. For banking supervisors, this argues for closer monitoring of the composition and stability of retail funding. Stress-testing and supervisory reviews should consider both the pressure on margins when deposits are being repriced rapidly and also banks’ capacity to absorb this pressure.
The views expressed in each blog entry are those of the author(s) and do not necessarily represent the views of the European Central Bank and the Eurosystem.
Check out The ECB Blog and subscribe for future posts.
For topics relating to banking supervision, why not have a look at The Supervision Blog?
“The European Central Bank is the prime component of the Eurosystem and the European System of Central Banks as well as one of seven institutions of the European Union. It is one of the world’s most important central banks.”
Please visit the firm link to site