

27 July 2026
Why have energy prices risen less during the Iran war than after Russia’s invasion of Ukraine? This ECB Blog post compares the two episodes and explains the role of market buffers, demand and competition for LNG shipments.
The wars in Ukraine and Iran have both led to significant energy shocks and, as a result, rising energy prices. Yet the two shocks differ markedly in terms of both scale and market impact.[1] Most notably, although the disruptions to global oil and gas supplies have been considerably larger during the Iran conflict, the resulting price increases have so far been comparatively muted. To understand why, this post examines the dynamics of energy commodity markets.
The Iran war has disrupted oil supply more severely
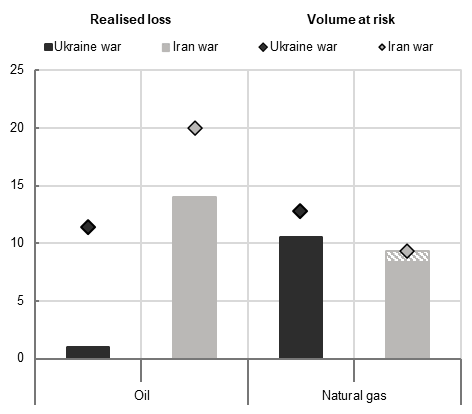
Military strikes between the United States, Israel and Iran in late February 2026 led to the closure of the Strait of Hormuz. This interrupted the transit of around 20 million barrels per day (mb/d), equivalent to one-fifth of global oil supply. Although Saudi and Emirati pipeline networks have partially mitigated the disruption, the conflict has nevertheless resulted in an average supply loss of around 14 mb/d so far, representing 14% of global oil supply. By contrast, the war in Ukraine reduced oil supply by only around 1 mb/d, or 1% of global output, since most of Russia’s 10 mb/d of oil production continued to reach world markets despite the sanctions put in place (Chart 1, panel a).
Chart 1
Size of the energy shock and oil futures curve reaction
|
a) Size of the shock |
b) Changes in oil futures prices and consensus forecasts at different horizons |
|---|---|
|
(oil: mbd; gas: bcm/m) |
(percent) |
 |
 |
Sources: LSEG and authors’ calculations.
Notes: Panel a) compares energy market disruptions during the Ukraine war and the Iran war by showing the size of the realised shock (bars) and the volume of oil and gas at risk (diamonds). For oil, in the war in Ukraine, volume at risk refers to total Russian oil production in January 2022, while the realised shock corresponds to the peak decline in Russian oil supply observed in April 2022. For the Iran war, volume at risk refers to oil flows transiting through the Strait of Hormuz in 2025, while the realised supply shock accounts for mitigating factors, including the redirection of oil flows through Middle Eastern pipeline networks. For gas, volume at risk in the war in Ukraine refers to Russian pipeline exports to Europe in 2021, while the realised shock corresponds to the actual decline in Russian gas flows. For the Iran conflict, both the volume at risk and the realised gas shock refer to disruptions affecting Liquefied Natural Gas (LNG) volumes transiting through the Strait of Hormuz. The dashed yellow area for the Iran war represents Europe’s exposure to Middle Eastern LNG disruptions.
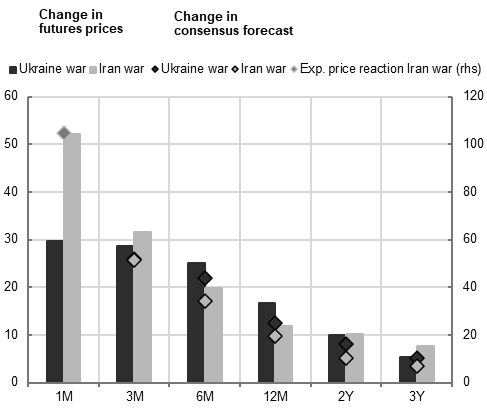
Panel b): Bars show changes in futures prices across different maturities. For the Ukraine war, changes are measured from 24 February 2022 to the initial price peak on 8 March 2022; for the Iran war, they are measured from 27 February 2026 to the initial price peak on 31 March 2026. Diamonds show changes in consensus forecasts over the same periods (February to March 2022 and February to March 2026, respectively). For consensus data, forecast horizons correspond to the closest futures maturities (e.g. 1Q ahead to 3-month futures, 2Q to 6-month futures, 4Q to 12-month futures). Expected price reactions for the Iran war are based on historical elasticities from Caldara et al. (2019). The latest observations are for 8 March 2022 (Ukraine war) and 31 March 2026 (Iran war).
The scale of the disruption is unprecedented. However, the oil price response in 2026 has been surprisingly restrained. This may be the result of hopes that the supply shortage will be temporary. By historical standards, a disruption of this magnitude would typically push up oil prices by as much as 105% (Caldara et al. 2019).
And yet, by early June, oil prices stood at only around USD 94 per barrel, 29% above their pre-conflict level, after retreating from a peak increase of more than 50%. Similarly, prices rose by around 30% at their peak following Russia’s invasion of Ukraine – a broadly similar response despite a far smaller supply shock. That increase was also short-lived, with prices stabilising at lower levels by August 2022.
Meanwhile, the oil futures market tells a similar story, with a smaller upward shift in the futures curve relative to the size of the shock during the Iran war. Another striking feature of this episode is that price increases have been concentrated in short-dated contracts. As a result, the curve moved into steeper backwardation: compared with 2022, near-term oil prices rose even more relative to longer-term prices in 2026 (Chart 1, panel b). This suggests that investors placed a higher value on immediate oil availability in 2026 than they did in 2022, pointing to elevated near-term upside risks to oil prices associated with the Iran war.
Oil markets were better prepared this time round
Alongside expectations of a swift resolution to the conflict, oil prices have also remained relatively contained thanks to a market that was better positioned to absorb supply disruptions than it was in 2022.
- First, the oil market entered the conflict with an oil supply surplus of around 2.5 mb/d. Among other factors, this was underpinned by record US shale output and by China’s shift to electric vehicles.[2] This contrasts sharply with the conditions before the Ukraine war, when oil markets were already tight and the supply deficit stood at around 1 mb/d.
- Second, inventories were significantly higher than in 2022. In addition to larger OECD stocks, China’s substantial stockpiling provided an extra buffer. Chinese inventories are estimated to have risen from 92 days of import cover in 2023 to around 115 days by early 2026. This helped to cushion the impact of supply losses.
- Third, lower demand, particularly in Asia, helped contain price pressures in 2026. Key factors here were weaker Chinese petrochemical consumption and lower demand for jet fuel in the Middle East. In response to these developments, the International Energy Agency (IEA) revised its global oil demand forecast for the second quarter of 2026 down by 3 mb/d relative to its January outlook. It is currently projecting a year-on-year decline in demand of around 2%. This contraction is considerably larger than the one observed following the Ukraine war, when oil demand in the second quarter of 2022 was only 0.6 mb/d below the IEA’s pre-war forecast.[3]
- Finally, policymakers have reacted more forcefully. The IEA’s coordinated strategic release of oil inventories of 400 million barrels far exceeded the 182 million barrels released in 2022.
Together, these factors help explain why a much larger supply shock has translated into a comparatively muted increase in oil prices.
Similar gas disruptions, smaller price increases
The contrast between the two crises can also be seen on the gas markets. While both conflicts resulted in supply losses amounting to around 9% of combined Asian and European gas demand, they differed in terms of the type of gas affected and the regions most directly exposed.
The war in Iran has disrupted the global LNG market. The Strait of Hormuz accounts for 20% of global LNG supply, equivalent to around 110 billion cubic metres (bcm) annually (Chart 1, panel a). By contrast, the war in Ukraine primarily affected pipeline gas, the impact of which was highly concentrated in Europe, with Russian exports to the region declining by 126 bcm in 2022.
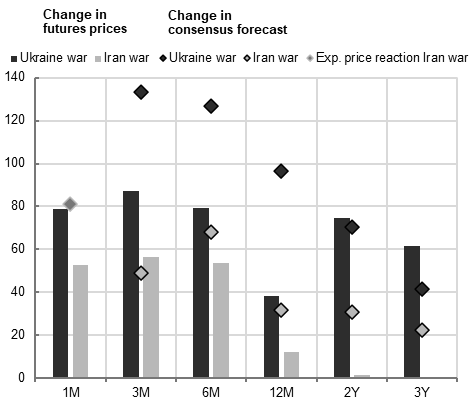
However, as in the oil markets, the reaction of gas prices during the Iran war has been notably more muted than historical experience would suggest. By early June, Title Transfer Facility (TTF) natural gas prices, the most common European gas benchmark, had risen by 53% to €49 per megawatt-hour (MWh). Meanwhile, estimates based on historical data would suggest an increase of around 81%, broadly in line with the 79% price rise observed during the Ukraine war.
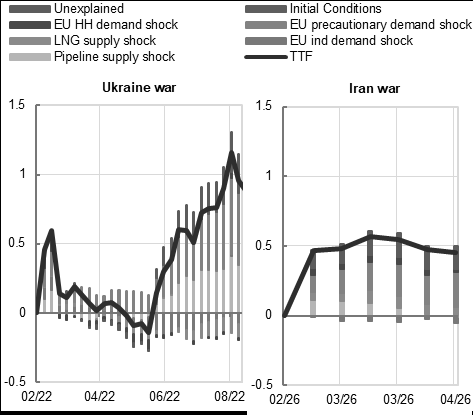
Given the similar size of the two supply shocks, this points to a more subdued market reaction in 2026. The two episodes also differ in terms of their underlying economic drivers. Adolfsen et al. (2026) suggest that the recent increase in TTF gas prices largely reflects precautionary demand shocks. In other words, price pressures increased owing to concerns over potential disruptions rather than actual supply losses, as Europe’s direct dependence on Middle Eastern LNG remains limited (Chart 2, panel a).
Conversely, during the 2022 energy crisis, while the initial increase in TTF gas prices reflected precautionary demand, it was subsequently amplified by physical supply disruptions, as declining Russian pipeline flows led to severe market tightness. The gas futures curve also indicated a more muted price reaction following the recent conflict. For instance, one and two-year futures rose by 12% and 2% during the Iran war, compared with 38% and 74% during the Ukraine conflict (Chart 2, panel b).
Chart 2
Gas price decomposition and gas futures curve reaction
|
a) Gas price decomposition |
b) Changes in gas futures prices and consensus forecasts at different horizons |
|---|---|
|
(percent) |
(percent) |
 |
 |
Sources: LSEG, Bloomberg, Gas Infrastructure Europe and authors’ calculations.
Notes: Panel a): The model is based on a weekly BVAR using the TTF gas price (1m future), inventories, NWE gas consumption, EU pipeline and LNG gas imports and the average of stock indices for gas price-sensitive sectors. The shocks are identified using sign and relative magnitude restrictions. The left panel covers the first months of the Ukraine war (February to August 2022), while the right panel covers the initial months of the Iran war (February to April 2026). The latest observations are for 28 August 2022 (left panel) and 10 April 2026 (right panel) (weekly data).
Panel b): Bars show changes in futures prices across different maturities. For the Ukraine war, changes are measured from 24 February 2022 to 31 August 2022; for the Iran war, they are measured from 27 February 2026 to the latest observation on 4 June 2026. Diamonds show changes in consensus forecasts over the same periods (February to August 2022 and February to May 2026, respectively). For consensus data, forecast horizons correspond to the closest futures maturities (e.g. 1Q ahead to 3-month futures, 2Q to 6-month futures, 4Q to 12-month futures). Expected price reactions for the Iran war are based on historical elasticities from Albrizio et al. (2023). The latest observations are for 31 August 2022 (Ukraine war) and 4 June 2026 (Iran war).
Weaker competition for LNG shipments contained gas prices
Several factors can help explain why gas prices have reacted more moderately in 2026 than during the Ukraine energy crisis.
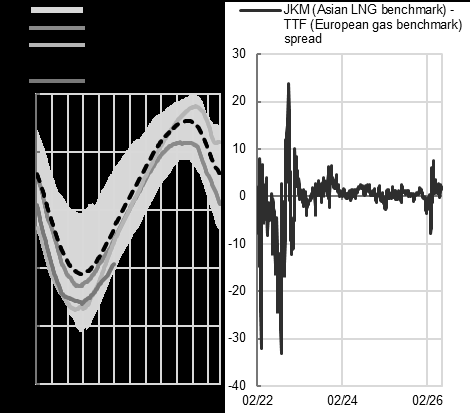
First, the pre-shock conditions were favourable. In early 2026, TTF natural gas prices ranged between €28 and €40 per MWh. This reflected well-supplied markets following Europe’s diversification away from Russian gas and the expansion of LNG import capacity. By contrast, European gas markets were already under stress before Russia’s invasion in February 2022, with TTF natural gas prices standing between €80 and €90 per MWh and a heavy reliance on Russian pipeline gas. Meanwhile, storage levels were low and broadly comparable in both episodes (Chart 3, panel a).
Second, competition with Asia for LNG shipments was weaker in 2026. Although the type of disruption – LNG or pipeline – does not in itself determine the price response, market dynamics depend critically on the affected region’s ability to secure replacement supplies quickly. In both crises, the volumes previously supplied under long-term contracts had to be replaced through spot LNG purchases. In 2022, Europe bid aggressively for shipments while also contending with weak hydropower and nuclear generation. As a result, the spread between the Asian LNG benchmark (JKM) and the European gas benchmark (TTF) turned sharply negative. As gas became more expensive in Europe than in Asia, LNG shipments were diverted to Europe, where suppliers could get a better price (Chart 3, panel a).
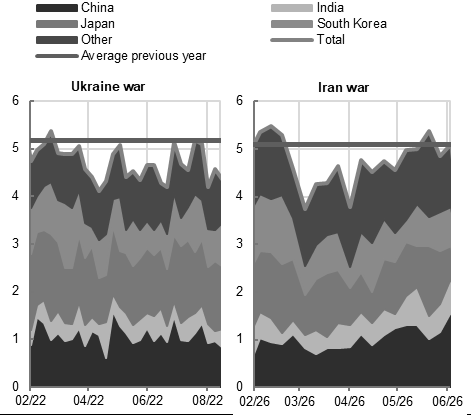
By contrast, the JKM-TTF spread turned positive in March 2026, creating incentives to reroute LNG shipments to Asia. However, its much smaller magnitude points to less aggressive Asian buying than Europe’s in 2022, reflecting greater demand flexibility thanks to gas-to-coal substitution and China’s more diversified energy mix. As a result, Asian LNG demand has fallen much more sharply in 2026 than it did in 2022 (Chart 3, panel b).
Together, these factors have significantly reduced competition for LNG shipments and helped curb upward pressure on global gas prices, despite a disruption that has affected a substantial share of global LNG trade.
Chart 3
European and Asian gas market dynamics: 2022 vs 2026
|
a) Gas storage utilisation rate and gas spreads |
b) Asian LNG imports |
|---|---|
|
(left panel: percent of total capacity; right panel: USD per MMBtu) |
(metric tonnes) |
 |
 |
Sources: LSEG, Bloomberg, Gas Infrastructure Europe and authors’ calculations.
Notes: Panel a) shows the gas storage utilisation rates for 2022, 2025 and 2026, alongside the historical average and the range observed between 2011 and the latest observation. The latest observations are for 4 June 2026 (left panel) and 2 June 2026 (right panel).
Panel b) shows weekly LNG imports by Asian countries (China, India, Japan, South Korea and others) during the initial months of the Ukraine war (left panel, 24 February to the end of August 2022) and the Iran war (right panel, 27 February to the end of June 2026). “Average previous year” refers to the average level of LNG imports in the corresponding previous year (2021 and 2025, respectively). The latest observations are for 30 August 2022 (weekly data, left panel) and 26 June 2026 (weekly data, right panel).
Looking ahead
The comparison between the Iran and Ukraine wars highlights an important lesson: the size of an energy supply disruption alone does not determine the price response. Initial market conditions, inventories, demand flexibility and expectations can all be just as important.
Overall, expectations of a swift end to the conflict, stronger pre-crisis oil and gas market fundamentals and greater flexibility in Asian demand have so far helped contain the impact on energy prices. Nevertheless, conditions in the Strait of Hormuz—and, by extension, on global energy markets—remain highly volatile, particularly following the renewed surge in energy prices triggered by the resumption of strikes between the United States and Iran in July. A prolonged closure would gradually deplete the existing buffers and global inventories while forcing markets to abandon expectations of a rapid resolution, thus increasing the risk of renewed upward price pressures.
Conversely, a sustained reopening of the Strait could exert significant downward pressure on prices, particularly as oil and gas markets entered 2026 with expectations of sizeable supply surpluses. These expectations may have strengthened further, as the Iran conflict could encourage consumers to transition more rapidly towards alternative, more reliable energy sources, reducing their reliance on oil and gas.
The views expressed in each blog entry are those of the author(s) and do not necessarily represent the views of the European Central Bank and the Eurosystem.
Check out The ECB Blog and subscribe for future posts.
For topics relating to banking supervision, why not have a look at The Supervision Blog?
References
Adolfsen, J.F., Lappe, M.S., Manu, A.S., Rößler, D., Schupp, F. and Stalla-Bourdillon, A. (2026), “Gas market shocks: Tracing the effect on Euro Area inflation expectations”, Journal of Macroeconomics, Vol. 8, 103760.
Albrizio, S., Bluedorn, J., Koch, C., Pescatori, A. and Stuermer, M. (2023), “Sectoral shocks and the role of market integration: The case of natural gas”, in AEA Papers and Proceedings, Vol. 113, pp. 43-46, American Economic Association, Nashville, May.
Burian, V. and Stalla-Bourdillon, A. (2026), “Non-linearities in oil prices: which conditions matter?”, Economic Bulletin, Issue 2, ECB.
Caldara, D., Cavallo, M. and Iacoviello, M. (2019), “Oil price elasticities and oil price fluctuations”, Journal of Monetary Economics, Vol. 103, pp. 1-20.
“The European Central Bank is the prime component of the Eurosystem and the European System of Central Banks as well as one of seven institutions of the European Union. It is one of the world’s most important central banks.”
Please visit the firm link to site