

11 November 2026
The sovereign debt crisis led to a marked increase in wealth inequality in the euro area. Since then, inequality has slowly returned to pre-crisis conditions. Yet, its effects are still felt and visible today in the countries most severely affected by the crisis.
In its short life, the euro area has already had its fair share of macroeconomic shocks, from the sovereign debt crisis to the COVID pandemic and the inflation surge. These shocks hit euro area citizens very differently across countries and social groups, with implications for the distribution of wealth. To understand how the wealth distribution evolved we are using a unique data set, the Eurosystem Household Finance and Consumption Survey (HFCS). It is based on around 90.000 interviews with households, representative of the population in 22 countries and conducted roughly every three years.[1]
How we measure inequality
Wealth inequality describes how rich or poor certain households are compared to all others, not in absolute terms. An economy could be at the same time very equal and impoverished, if all households were equally indigent. Assessing the evolution of wealth inequality is not always straightforward. One could easily conclude that inequality has increased, if the (relatively) wealthy have become wealthier and the (relatively) poor poorer. But what if, for example, the poor have been poorer, but the middle class moved closer to the richest households in the economy?
Many different indicators provide summary measures of inequality. We consider four of them to assess the evolution of net wealth inequality in the euro area. The most prominent indicator is the Gini coefficient. It ranges between 0 in a totally egalitarian society (complete equality) and 100 when one household has all the wealth and all others have nothing (maximum inequality). A higher coefficient signals heightened inequality.
But does this stem from growing wealth concentration in the hands of the rich? Or is it due to a lower prosperity of the middle class? Or is it a combination of both? To those questions, the Gini coefficient is blind.
Hence, we use the other three indicators that are more informative. They order all households by increasing levels of net wealth and focus on the groups belonging to a certain percentile of the ordered distribution.
The ups and downs of inequality in the euro area as a whole
Table 1
Indicators of net wealth inequality, 2010-2023

Notes: The P90/P50 ratio denotes the ratio of 90th percentile of the distribution to the 50th percentile (median). The share of the top 10% of households denotes the fraction of aggregate household wealth owned by the wealthiest 10% of households, in percent. The share of the bottom 50% of households denotes the fraction of aggregate household wealth owned by the half of the population with the lowest net wealth, in percent.
So, what do the four measures tell us about the changing wealth distribution in the euro area?
Overall, the four indicators show that inequality significantly increased early on, between 2010 and 2014. Since then, the wealth distribution gradually returned to its initial level for the euro area (Table 1).
In particular, the Gini coefficient, after rising from 68.2 in 2010 to 69.7 in 2014, has slowly declined thereafter. In 2023 it came down to 68.5, a value close to that recorded in 2010. This tells us that indeed inequality has risen but has come down as of recent.
Building on this general observation, the other indicators show that the increase in inequality between 2010 and 2014 is the result of congruent movements in all parts of the wealth distribution. That means that the increase in inequality was not driven by either the poor becoming poorer or the rich richer. Rather, both have become better off, but at different levels. More precisely, the share of net wealth owned by the wealthiest households (top 10%) increased from 50.8% to 52.6%, while the share of the poorer half dropped from 6.0% to 5.4%. Moreover, a household ranked in the middle of the 90th percentile of the wealth distribution – with 90% of the others poorer and 10% richer – went from owning 4.7 times the wealth of the median household in 2010, to 5 times in 2014.
The decrease in inequality recorded by the Gini since 2014 has been more unevenly distributed across households. After the sovereign debt crisis, the poorer half of the survey participants recouped their relative loss and held 6.2% of all wealth in 2023, up from 6% in 2010.
However, relative gains at the bottom of the net wealth distribution were not accompanied by losses at the top: the net wealth share owned by the top 10% of households, though declining from the peak of 2014, stood in 2023 a full percentage point above the 2010 level, at 51.8%. At the same time, a household ranked in the 90th percentile of the wealth distribution continued owning five times the wealth of the median household in 2023, unchanged from 2014.
Inequality up – especially in countries most hit by the sovereign debt crisis
What drives these developments? The increase of inequality recorded between 2010 and 2014 spans the years of the sovereign debt crisis. Market concerns about the sustainability of Greek public debt intensified in early 2010, and then spread to Ireland, Portugal and later also Spain, Cyprus and Italy. Yields of government bonds increased, especially for these countries. They impaired the transmission of monetary policy and led to a euro area recession, including a fall in house prices.
Falling house prices were the most important reason for the increase in net wealth inequality. They hit hardest the families that had borrowed to buy their house, because the value of their real estate declined, but their debt remained unchanged. Liquid savings were also dented by the crisis, more so for households at the bottom of the wealth distribution.
By contrast, the price of equity shares, that are mostly held by wealthier households, rebounded quite quickly. All these effects contributed to the increase in inequality highlighted in Table 1.
While the recession was euro area wide, it was felt especially strongly in the countries most heavily affected by the sovereign debt crisis. Since these countries, Cyprus, Spain, Greece, Ireland, Italy, Portugal, faced more persistently depressed house prices and incomes, it is hardly surprising that they also experienced a larger increase in inequality between 2010 and 2014, compared to other euro area countries. All four indicators agree in this assessment, as highlighted in Table 2.
Table 2
Indicators of net wealth inequality: Countries most affected by the sovereign debt crisis of 2010-2013 vs. other countries
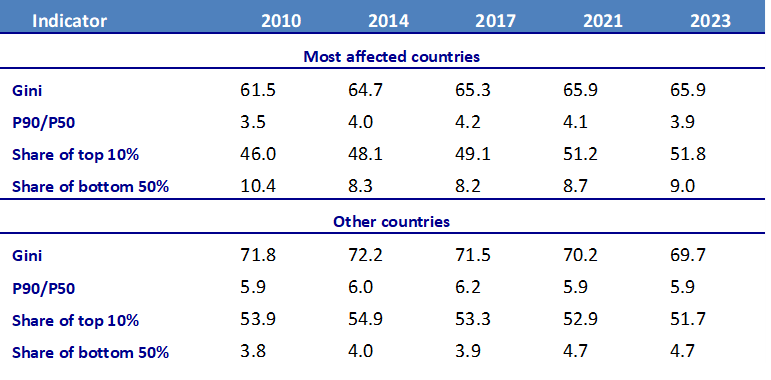
Notes: See table 1. Most affected countries: Cyprus, Spain, Greece, Ireland, Italy, Portugal; Other countries: Austria, Belgium, Germany, Estonia, Finland, France, Lithuania, Luxembourg, Latvia, Malta, the Netherlands, Slovenia, Slovakia.
Moreover, the increase was much more persistent in the countries most affected by the crisis. There the Gini kept rising until 2021, and in 2023 was still above its levels of 2010 and 2014. By contrast, the Gini quickly began returning to pre-crisis levels in the other countries and, in 2023, it stood 2.1 percentage points below its 2010 mark.
One determinant of these contrasting developments was the inability of the poorest households in the countries most affected by the crisis to quickly rebuild their saving buffers. An additional factor shown by the HFCS data was the declining homeownership rate in the most affected countries, mostly visible among younger households. House prices gradually recovered, which should have reduced inequality.
However, with a lower homeownership rate fewer households could benefit from house price increases after the crisis. And that exerted a persistent upward pressure on wealth inequality. Overall, inequality in the most affected countries remained stable after 2014.
In sum, the HFCS data confirm the argument that the sovereign debt crisis was not just consequential for inequality in the euro area, but especially so for the countries most affected by the crisis.
Inequality gradually declining since 2014 – but not in every country
Between 2014 and 2017, the economic recovery reversed some of the factors that had adversely affected net wealth before 2014. For the euro area, inequality measures moved towards their pre-crisis levels. During the COVID pandemic of 2020, wealth inequality remained stable. One reason for this is the government support to vulnerable households.
Developments between 2021 and 2023 were heavily affected by the temporary inflation surge. This changed households’ wealth through three main channels. First, it increased the cost-of-living and forced especially poorer households to eat into their savings. Poorer households usually spend a higher proportion of their income on essentials such as energy, and energy goods experienced the largest price increases.
Second, the inflation surge led to a reduction in the real value of assets. This effect was particularly pronounced for bank deposits. Although their nominal value was constant, due to inflation the same amount of money bought less goods and services. So, their real values decreased permanently. The drop in real value applied also to equities or houses. And so, asset-rich households were the most adversely affected by this channel.
Third, inflation reduced the real value of debt. This channel benefited more heavily indebted households. Also considering targeted fiscal measures implemented in many countries, the last two channels dominated.[2] Households with higher debt-to-asset ratios, that tend to be poorer in terms of net wealth, experienced smaller losses or even marginal gains, somewhat reducing inequality.
Conclusion
This post shows that the sovereign debt crisis of 2010–2013 led to a significant increase in inequality. The increase was especially strong and persistent in the countries most severely affected by the crisis. Since that time, inequality in the euro area has returned to levels seen before the sovereign debt crisis. This downward trend continued through the COVID pandemic and the inflation surge. But if we look separately at the countries which were hit hardest by the sovereign debt crisis, the picture is different. There the level of inequality remains elevated and well above pre-crisis levels.[3]
The views expressed in each blog entry are those of the author(s) and do not necessarily represent the views of the European Central Bank and the Eurosystem.
Check out the ECB Blog and subscribe for future posts.
For topics relating to banking supervision, why not have a look at The Supervision Blog?
“The European Central Bank is the prime component of the Eurosystem and the European System of Central Banks as well as one of seven institutions of the European Union. It is one of the world’s most important central banks.”
Please visit the firm link to site