


6 October 2026
AI has the potential to reshape the euro area economy. This ECB Blog post explores how AI investments are being financed, focusing on the current financing mix of the most AI-intensive sectors and the consequences for monetary policy.
Euro area firms are taking part in the artificial intelligence (AI) revolution. And, as discussed in a previous ECB Blog post, those operating in the most AI-intensive sectors often rely more on internal funds. Firm balance sheet data reveal that AI-intensive firms have recently started to turn more towards market-based financing as a source of debt financing, rather than relying on traditional bank lending. A deeper and more integrated European capital market could support this development and help euro area firms to harness the full benefits of the AI revolution.
Adopting AI versus developing AI
Rapid advances in AI are prompting firms to invest more heavily in digital technologies in the euro area, and even more so in the United States.[1] Between 2023 and 2025 the share of euro area firms using at least one form of AI technology more than doubled. Technologies for generating and analysing written and spoken language and, more recently, images and videos have been driving this development. Firms engage with AI in different ways: some mainly adopt AI by using existing tools to enhance their operations, while others develop AI by building new models, applications or technologies, and protecting their innovations through patents. This distinction matters because adoption and development involve different types of investments, risks and financing needs. Adopting AI often requires investments in software, data systems and staff skills. By contrast, developing AI typically demands larger and riskier investments in research, computing capacity and specialised talent.
For our analysis, we classified euro area economic sectors according to their levels of AI adoption and development. We did this using survey data on firms’ use of AI technologies to measure AI adoption and AI patent data to measure AI development. The data shows that both adoption and development are unevenly distributed across sectors. Some sectors, such as media, telecommunications and IT services, are active both as adopters and developers. Other sectors, such as legal and accounting, mainly adopt AI developed elsewhere (Chart 1).
Chart 1
Euro area economic sectors: AI adopters and AI developers
(index)
Sources: Eurostat, PATSTAT and ECB calculations. Notes: NACE sectors are classified into four quartiles of AI adoption based on a Eurostat survey on the use of information and communications technology in enterprises and four quartiles of AI development based on the share of AI-related patent applications for developers. The identification of AI patents follows and expands on the methodology outlined in the report OECD (2025), Identifying emerging AI technologies using patent data, September. “High” corresponds to the top quartile of AI adopting (developing) sectors. “Low” corresponds to the bottom quartile of AI adopters (developers). “Medium” contains the central two quartiles of AI adopting (developing) sectors (25th to 75th percentile). Sector shares are based on the average across the years 2023-25. The latest observations are for 2025.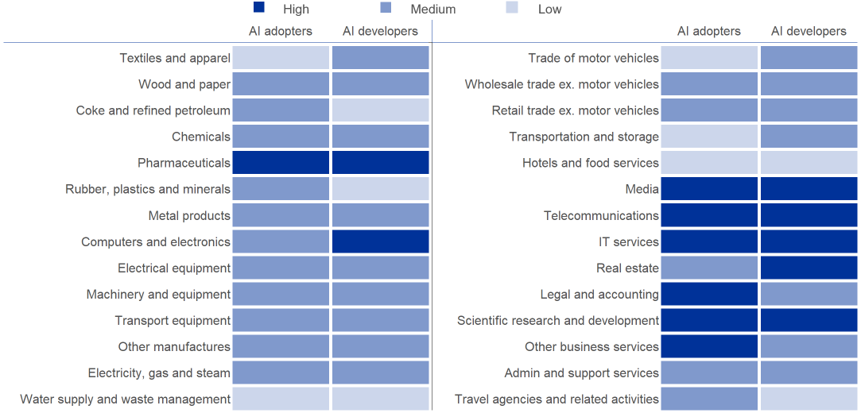
Funding AI activities
In the euro area, AI-intensive firms tend to be those listed on the stock market or backed by private equity financing like venture capital.[2] So they may rely less on debt to fund their AI investments. Moreover, AI-related investments often differ from traditional capital spending as they focus more on intangible assets such as software, data, algorithms and organisational know-how. These assets can be harder to pledge as loan collateral than physical assets, such as machinery or buildings. As a result, firms may end up borrowing more money from financial markets rather than banks.
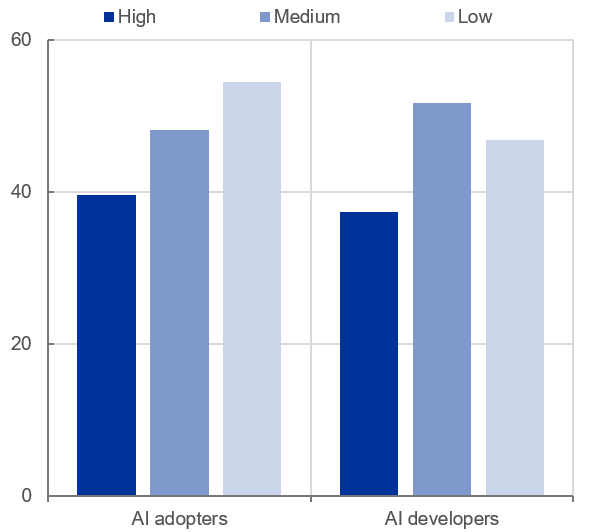
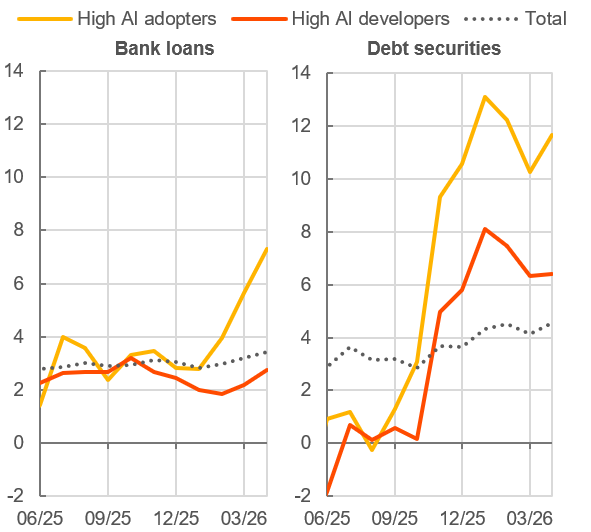
Firm balance sheet data at the sectoral level point in this direction. Firms in the most AI-intensive sectors, particularly AI developers, tend to be less leveraged than other sectors (Chart 2, panel a). This means that they rely less on borrowed funds and more on equity.[3] AI-intensive firms have recently turned more to market-based sources, such as debt securities, when raising debt funding. This shift is particularly pronounced among high AI adopters (Chart 2, panel b). From a monetary policy perspective, this development matters in two ways. First, debt securities usually have longer maturities, so these recent financing choices are less sensitive to interest rate hikes and more sensitive to changes affecting the long end of the yield curve. Second, since AI-intensive firms rely less on debt overall, their investment may be less sensitive to the cash-flow channel of monetary policy than that of other firms when interest rates rise.
Chart 2
Firm financing by AI activity
|
a) Leverage |
b) Growth in debt financing |
|---|---|
|
(index) |
(annual percentage changes) |
 |
 |
Sources: ECB (AnaCredit, CSDB, CSEC), Eurostat, PATSTAT, Orbis and ECB calculations.
Notes: In panel a), leverage is computed as gross debt over total assets and is rescaled to vary between 0 and 100. The industry median is used to avoid overweighting larger firms; the values are averaged from 2022 onwards. Panel b) shows the annual growth in debt financing for sectors classified as high AI adopters and high AI developers. The dotted line shows the total annual growth rate of each of these across all sectors. The latest observations are for the third quarter of 2025 for panel a) and April 2026 for panel b).
What is missing in Europe?
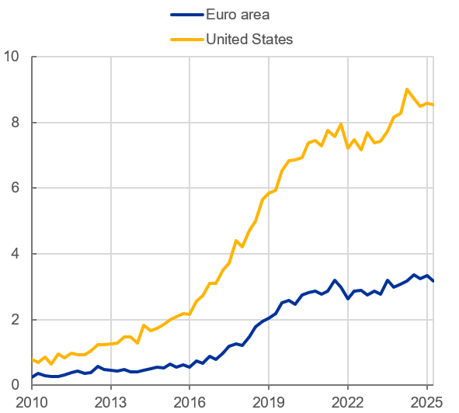
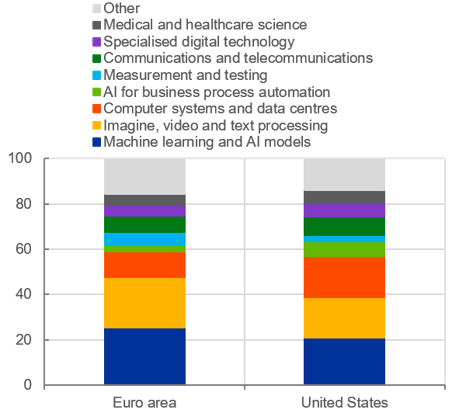
The euro area has seen substantial growth in AI patent activity over the last decade, though it still trails the levels seen in the United States (Chart 3, panel a). Euro area firms and researchers are active in many of the same technological fields as their US peers, including machine learning, data processing, communications and business process automation (Chart 3, panel b). When the economy experiences positive AI-related news, credit to firms and investment increase across both regions. However, the positive response of investment to AI-related news appears stronger in the United States than in the euro area (Chart 4).
But why is this the case? One possible explanation is that US firms can turn AI opportunities into funding and growth more easily. This is supported by their easier access to venture capital, deeper equity markets and larger unified market overall.[4] These same factors may also help explain why some European firms choose to relocate abroad – often to the United States – where access to capital and scale-up conditions are more favourable.[5] At the same time, investment fund flows reveal that euro area investors have been putting more and more money into US technology stocks, while investing less in European tech firms.
Chart 3
AI patent trends and field breakdown
|
a) Share of AI patents |
b) Technological field |
|---|---|
|
(percentage points) |
(percentage points) |
 |
 |
Sources: PATSTAT and ECB calculations.
Notes: The identification of AI patents follows and expands on the methodology outlined in the report OECD (2025), Identifying emerging AI technologies using patent data, September. This approach uses two complementary channels: (i) specific Cooperative Patent Classification (CPC) codes, and (ii) AI-related keywords in patent titles and abstracts extracted via textual analysis. In panel b), shares refer to 2025 data and the classification corresponds to specific CPC codes. The latest observations are for the second quarter of 2025.
Overall, the emergence of AI highlights the importance of completing the capital markets union. A deeper and more integrated European capital market could help AI-intensive firms find the funding they need at each stage of growth. Better capital markets could also steer European savings into European innovation. Together, such developments could support the euro area in realising its full potential and reaping the benefits of the AI revolution.
Chart 4
Peak effect of AI news shock on credit and investment
(percentage points)
Sources: ECB, Haver, PATSTAT and ECB calculations. Notes: The chart shows the peak effects of an unexpected increase in the share of AI patents in the euro area and the United States, respectively, representing expectations of AI-driven increases in productivity at the moment of patent-filing. The shock is calibrated to match the annual increase observed in 2024 in the euro area. It is based on quarterly Bayesian vector autoregression models for the two economic areas, with an internal instrument represented by the share of AI patents over total patents. The models contain variables for GDP, investment, consumer prices, debt, stock prices and measures of market rates and financing conditions. The models are estimated in a quarterly frequency from the first quarter of 1999 to the fourth quarter of 2024.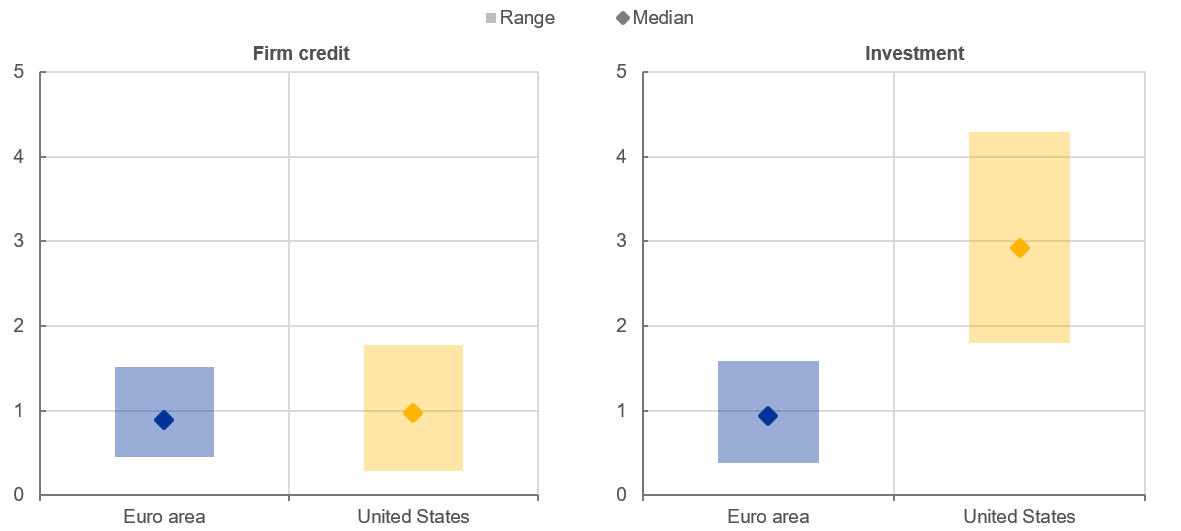
The views expressed in each blog entry are those of the author(s) and do not necessarily represent the views of the European Central Bank and the Eurosystem.
Check out The ECB Blog and subscribe for future posts.
For topics relating to banking supervision, why not have a look at The Supervision Blog?
“The European Central Bank is the prime component of the Eurosystem and the European System of Central Banks as well as one of seven institutions of the European Union. It is one of the world’s most important central banks.”
Please visit the firm link to site